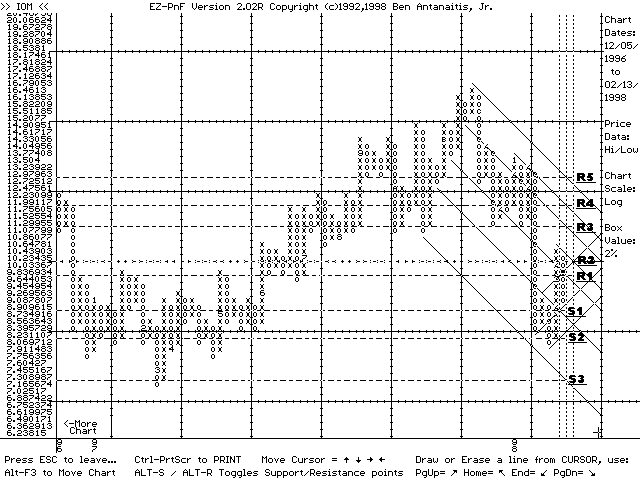
EZ-PnF V2.0U Sample chart of IOM(02/13/98):
Notes:
- The chart is a 3 box reversal Point and Figure chart.
- The chart is based on daily high and daily low prices.
- The chart is a 2% logrithmic chart, ie each chart box represents a price change of 2% of the value of the box above or below it.
- Three possible support prices and five possible resistance prices are shown, as well as the support/resistance lines.
- A 'resistance' or 'support' point is a price where an issue's upward or downward price movement may 'stall'. The ultimate result of the 'stall' may be either a continuation or a reversal of price movement, depending on whether there are more or less sellers than buyers at the specific price point.
- IOM is trading within an overall bearish trading channel. Currently, IOM appears to be in a 'retracement' after a 'long tail down' formation; having been taken out and shot after the last Q conference call. IOM is currently in a downtrend column ('O'). Support may be seen at points S1, S2, and S3. Resistance may be seen at points R1 through R5. If the uptrend column ('X') can form, resistance point R5 must be exceeded on volume to break out of the overall bearish trading channel.
To return to EZ-PnF home page, click here.
(Disclaimer, please read)